Size, and Shape Matters
- Andrew Stone
- May 2, 2017
- 3 min read
We all know that sizing a study is a critical part of trial design but unless you consider the shape of your curves you may be performing a study that is much larger than it needs to be.
The size of a study depends on the desired hazard ratio (HR), which in turn governs the number of events that need to be observed to guarantee power.
In practice, we often choose the desired HR, or alternative hypothesis, by considering the absolute benefit it’s likely to correspond to – standardly we assume the HR equals the ratio of medians. For example, for a 3 month improvement from 9 months is assumed to correspond to a HR of 9/12 = 0.75.
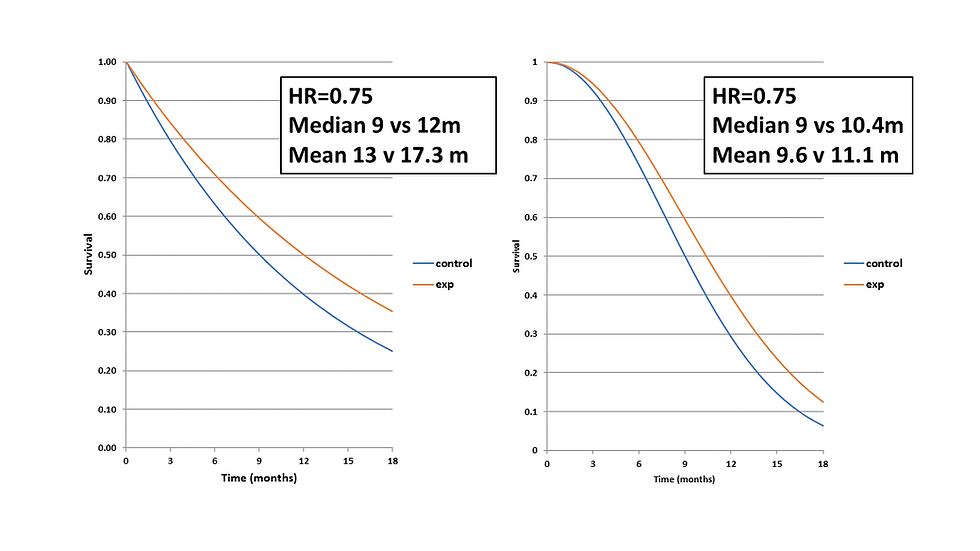
But let’s look at the following curves

They both have a HR of 0.75 and the same control group median yet, the difference in medians, and means, is quite different. So what’s going on?
Incidentally if we produced a Kaplan-Meier of the ranks the 2 curves they would then look identical but that’s for another time.
Shape Matters
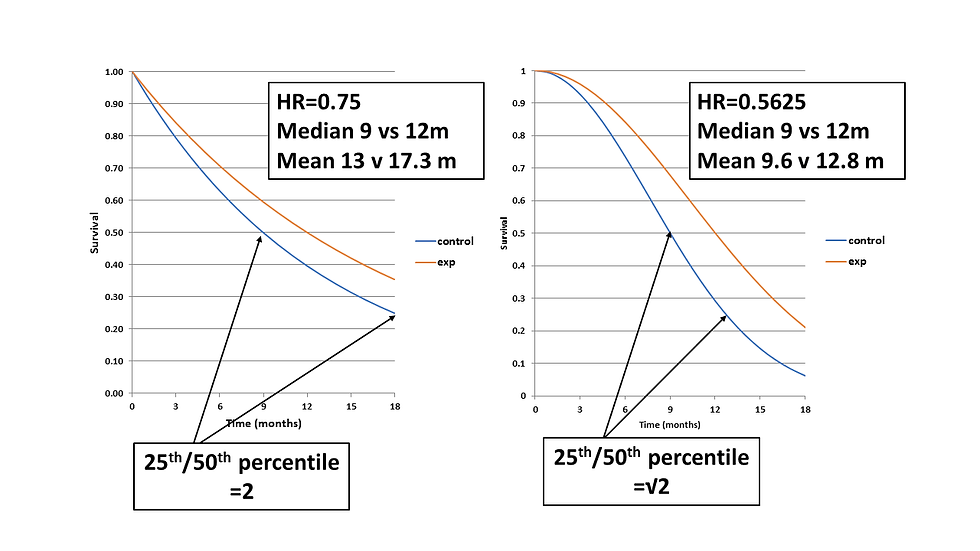
When we took the ratio of medians we were assuming the data were exponentially distributed. One easy way to tell whether this is true is to see whether there is a constant half-life and event rate. This would mean the time to reaching the 25th percentile of the survival curve would be double the median.
Often though the event rate increases during the study, especially in advanced cancers, and could mean the ratio of the 25th percentile and median is quite a bit less than two. The extent to which this is true is governed by the shape parameter from a weibull distribution. If the shape parameter was 2 then the ratio would be √2 . You do need though to be careful how your particular software parameterises the weibull.
So What?
Now let’s consider two curves with the same absolute difference/ratio in medians, and the same ratio of means but different shape parameters. As you can see they correspond to very different HRs with very different vertical separation.

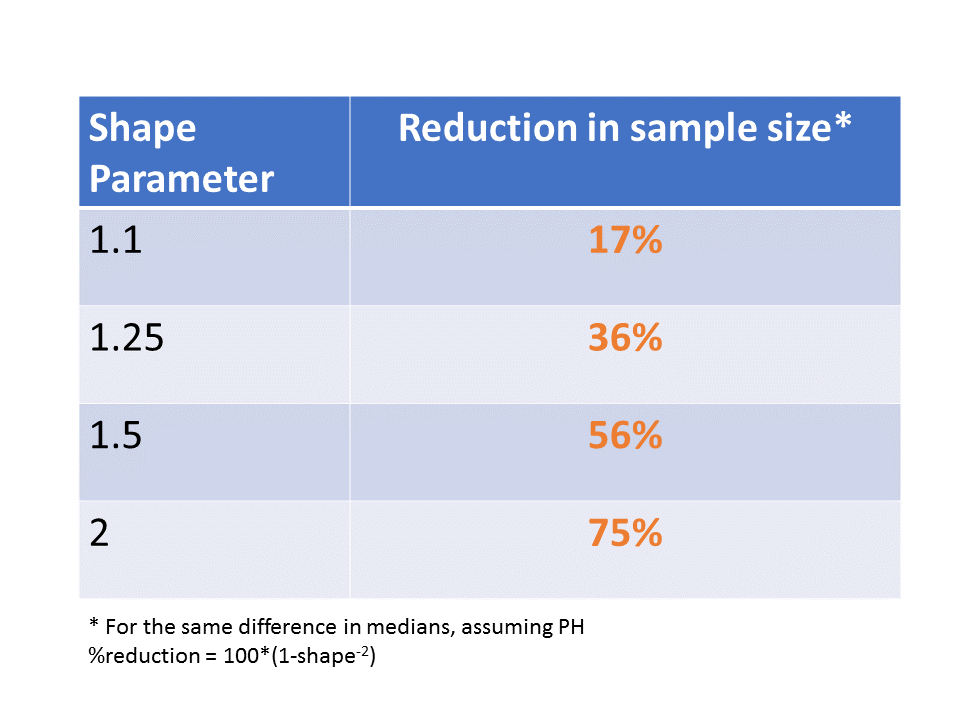
Well in this case if 3m was the clinically important difference and the shape parameter was 2 then, assuming proportional hazards, the trial could be made 75% smaller and still have the same power. A huge difference! On an intuitive level you can see that the data with a shape parameter of 2 has much less variability.
A shape parameter of 2 is quite possible but most likely at the upper end of what might be observed but the following table shows substantial reductions even for smaller shape parameters.

Yes But
There may be no reduction if in fact the data are exponentially distributed. Indeed, if the event rate slows with time, as has been observed for immunotherapy in some cases, you might actually need a bigger trial than you thought. But for sure it’s worth checking outcomes of previous trials to carefully examine the shape of the curves
Of course, there are additional considerations - aren’t there always with statistics! Who says clinical benefit is only defined in absolute benefit in term terms rather than reduction in risk? Personally I do think the absolute benefit is a very important component. And what about non-proportional hazards? This adds some complexity but the basic message remains the same.
Above all though, this shouldn’t be used as a tool to justify the number of patients you only ever wanted to recruit anyway!


Comments